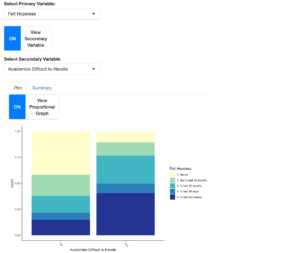
This project used a dataset about student health at Grinnell College in the year 2018. I created an interactive app that allows users to pick variables to visualize through graphs or summary tables. Options also included using one or two variables to look at potential relationships between them.

I also chose to specifically analyze variables related to sexual assault and feelings of safety at Grinnell, creating a report for another class on this topic.
Loading Viewer...